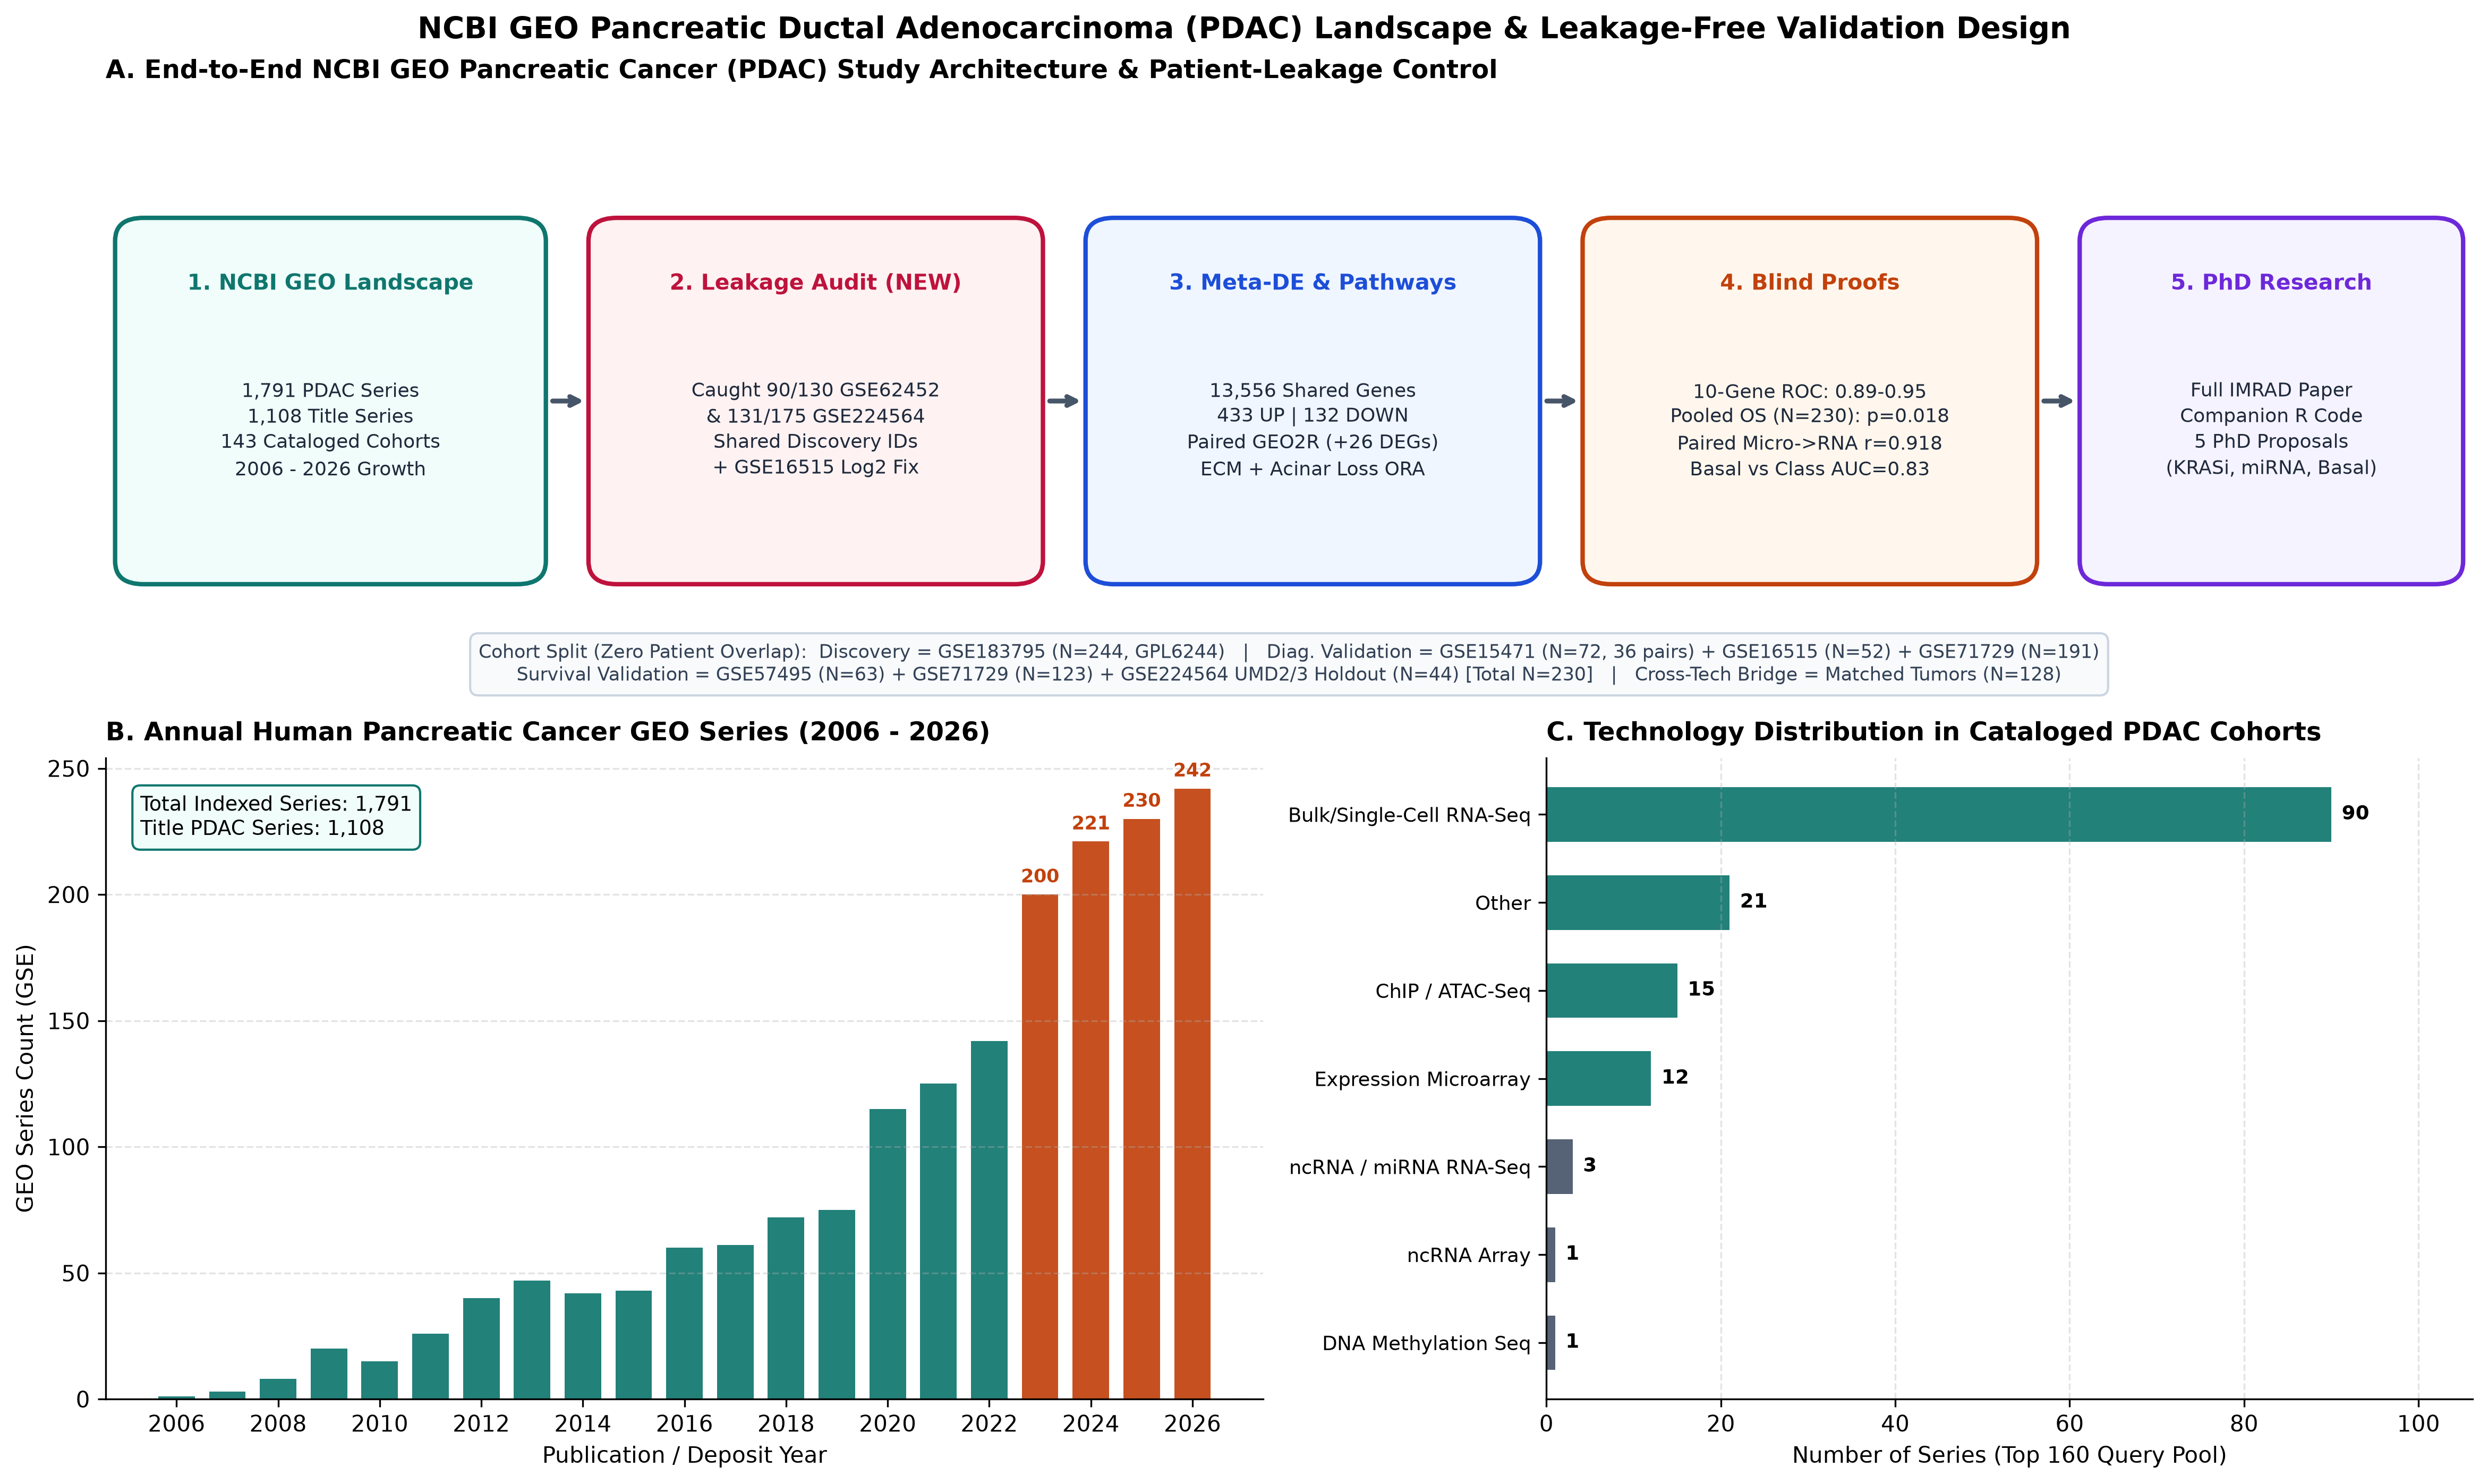
Figure 1. GEO PDAC Landscape & Study Design
1,791 indexed series (2006 to 2026), technology breakdown, and non-overlapping validation split.
Audited PDAC GEO meta-analysis uniting biomarkers, survival, and five PhD tracks.
Before statistical modeling, we benchmarked NCBI’s default GEO2R workflow and audited patient identifiers across consortium datasets.
Hover bars for yearly counts; orange highlights 2023 to 2026 acceleration.
GSE62452 (90/130) and GSE28735 (45 pairs) overlap Discovery GSE183795. Inside bulk RNA-seq GSE224564, 131/175 tumors (German-1/2/3 + UMD-1, 74.9%) match GSE183795, leaving 44 independent patients (UMD-2/3).GSE16515 distributes linear MAS5 intensities up to 65,045 (median 18.17), fixed by automated log2(x + 1) scaling._rep arrays in GSE15471 (78 to 72 arrays = 36 pairs) and running patient-blocked limma recovers +26 DEGs (1,584 vs 1,558 unpaired).GPL6244, GPL570, and GPL15048.Across 13,556 shared genes in four cohorts (r = 0.709 to 0.847), weighted Stouffer integration isolated 433 upregulated and 132 downregulated consensus markers paired with acinar enzyme collapse (17/18 genes, OR = 1,984.3, FDR = 2.74e-33).
| Gene | Dir | Mean log2FC | GSE183795 | GSE15471 | GSE16515 | GSE71729 | Meta-Z | Meta-FDR | Basal d | Program Role |
|---|
Pairwise log2FC correlations vs Discovery GSE183795 (13,556 shared genes):
r = 0.8466r = 0.7513r = 0.7092Trained strictly on GSE183795 via single-sample within-transcriptome standardization, then frozen prior to unseen validation.
On two-channel Agilent GSE71729, ranking performance stays high (AUC = 0.8883), whereas fixed p = 0.50 collapses Specificity to 0.000 due to Channel-1 reference shift. Youden calibration restores Specificity to 0.9348.
Compare leaked vs strictly de-leaked external survival generalization alongside 128 matched Microarray and RNA-seq patient tumors.
Exact tumors profiled by Affymetrix GPL6244 and Bulk RNA-Seq achieve r = 0.9180 (p = 1.87e-52).
The locked risk axis separates aggressive Basal-like tumors orthogonally from stromal fibroblasts and increases stepwise toward metastasis.
RNA-Seq (GSE224564): Basal (n=48, +0.768) vs Classical (n=95, -0.273), AUC = 0.8096 (p = 8.00e-10).
Array (GSE71729): Basal (n=89, +0.747) vs Classical (n=132, -0.193), AUC = 0.8341 (p = 1.91e-17), independent of Stroma (p = 0.234).
Mean Risk Score Z in GSE71729 rises cleanly across stages:
-0.641-0.076 (p = 3.43e-06)+0.368 (p = 2.56e-05)
Top Basal drivers in RNA-Seq: LY6D (d=+1.73), IL20RB (+1.69), KRT6A (+1.59), and ITGA3 (+1.49), converging on Oct 2026 CRISPR screen GSE349252.
Classical anchors: LYZ (-1.78), CLDN18 (-1.50), TSPAN8 (-1.45), LGALS4 (-1.45).
Click any manuscript panel to inspect full-resolution charts.
1,791 indexed series (2006 to 2026), technology breakdown, and non-overlapping validation split.
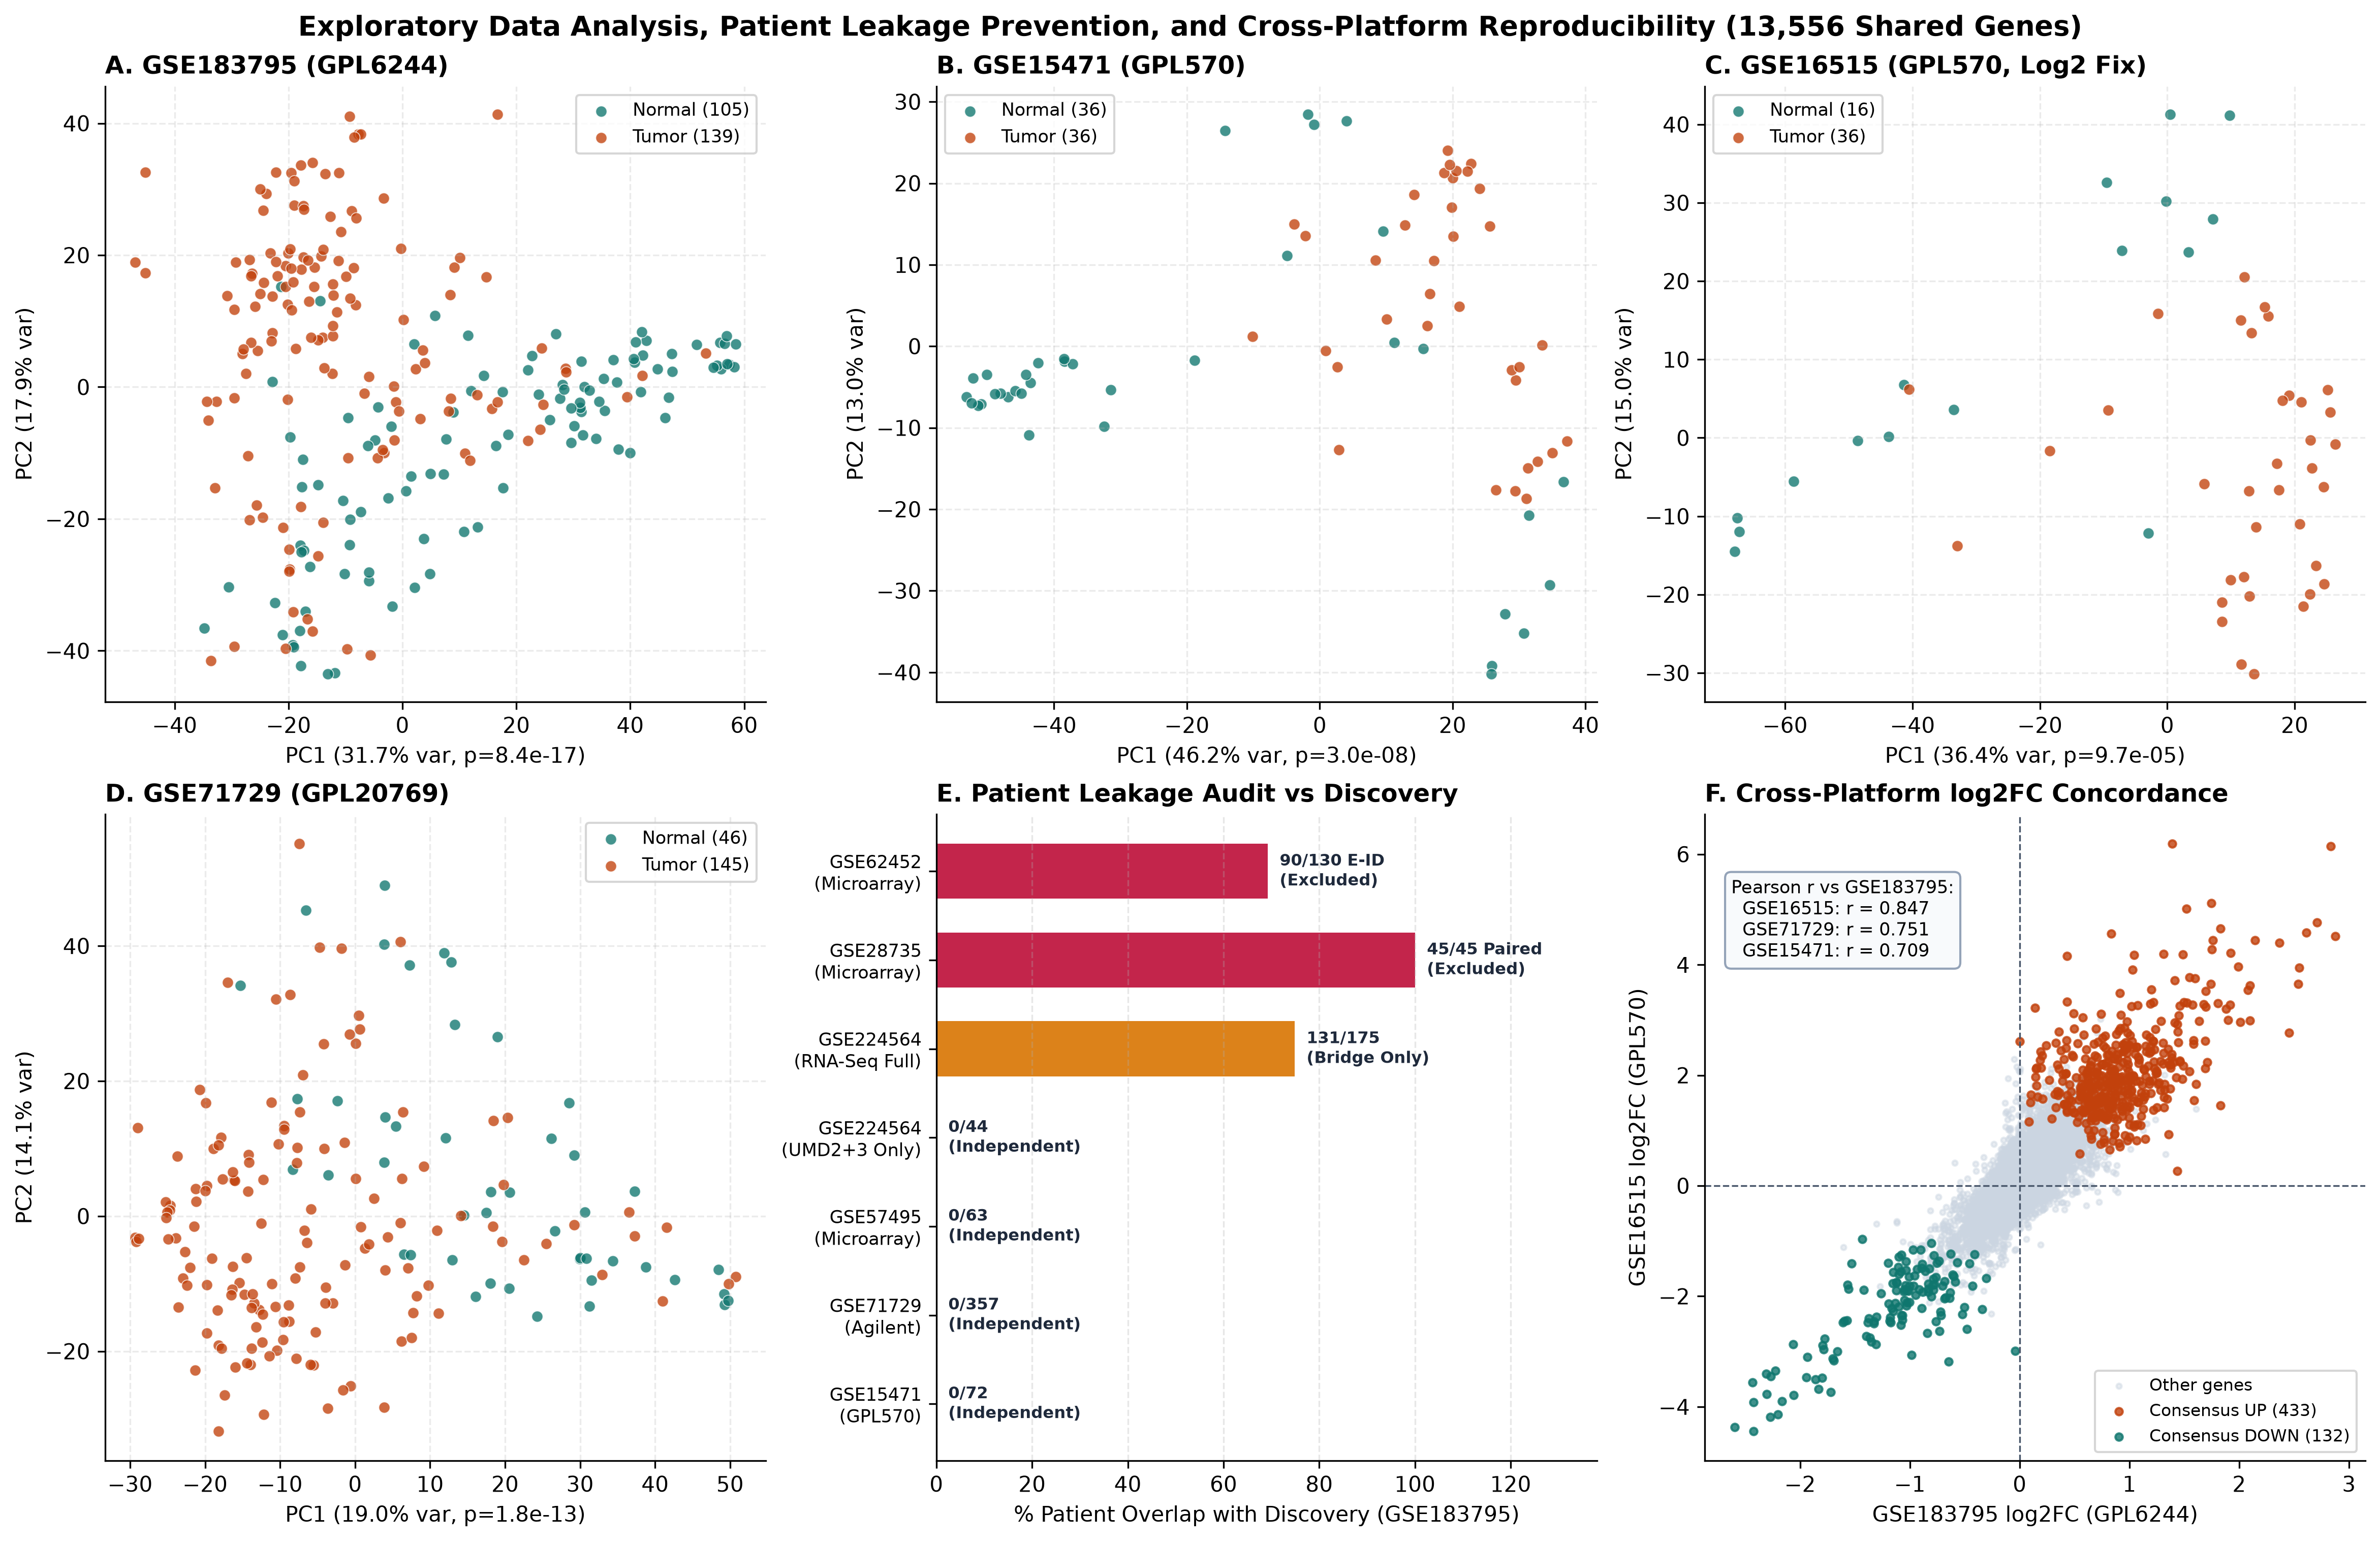
Tumor vs Normal PCA across 4 cohorts, overlap rates vs Discovery, and log2FC correlation.
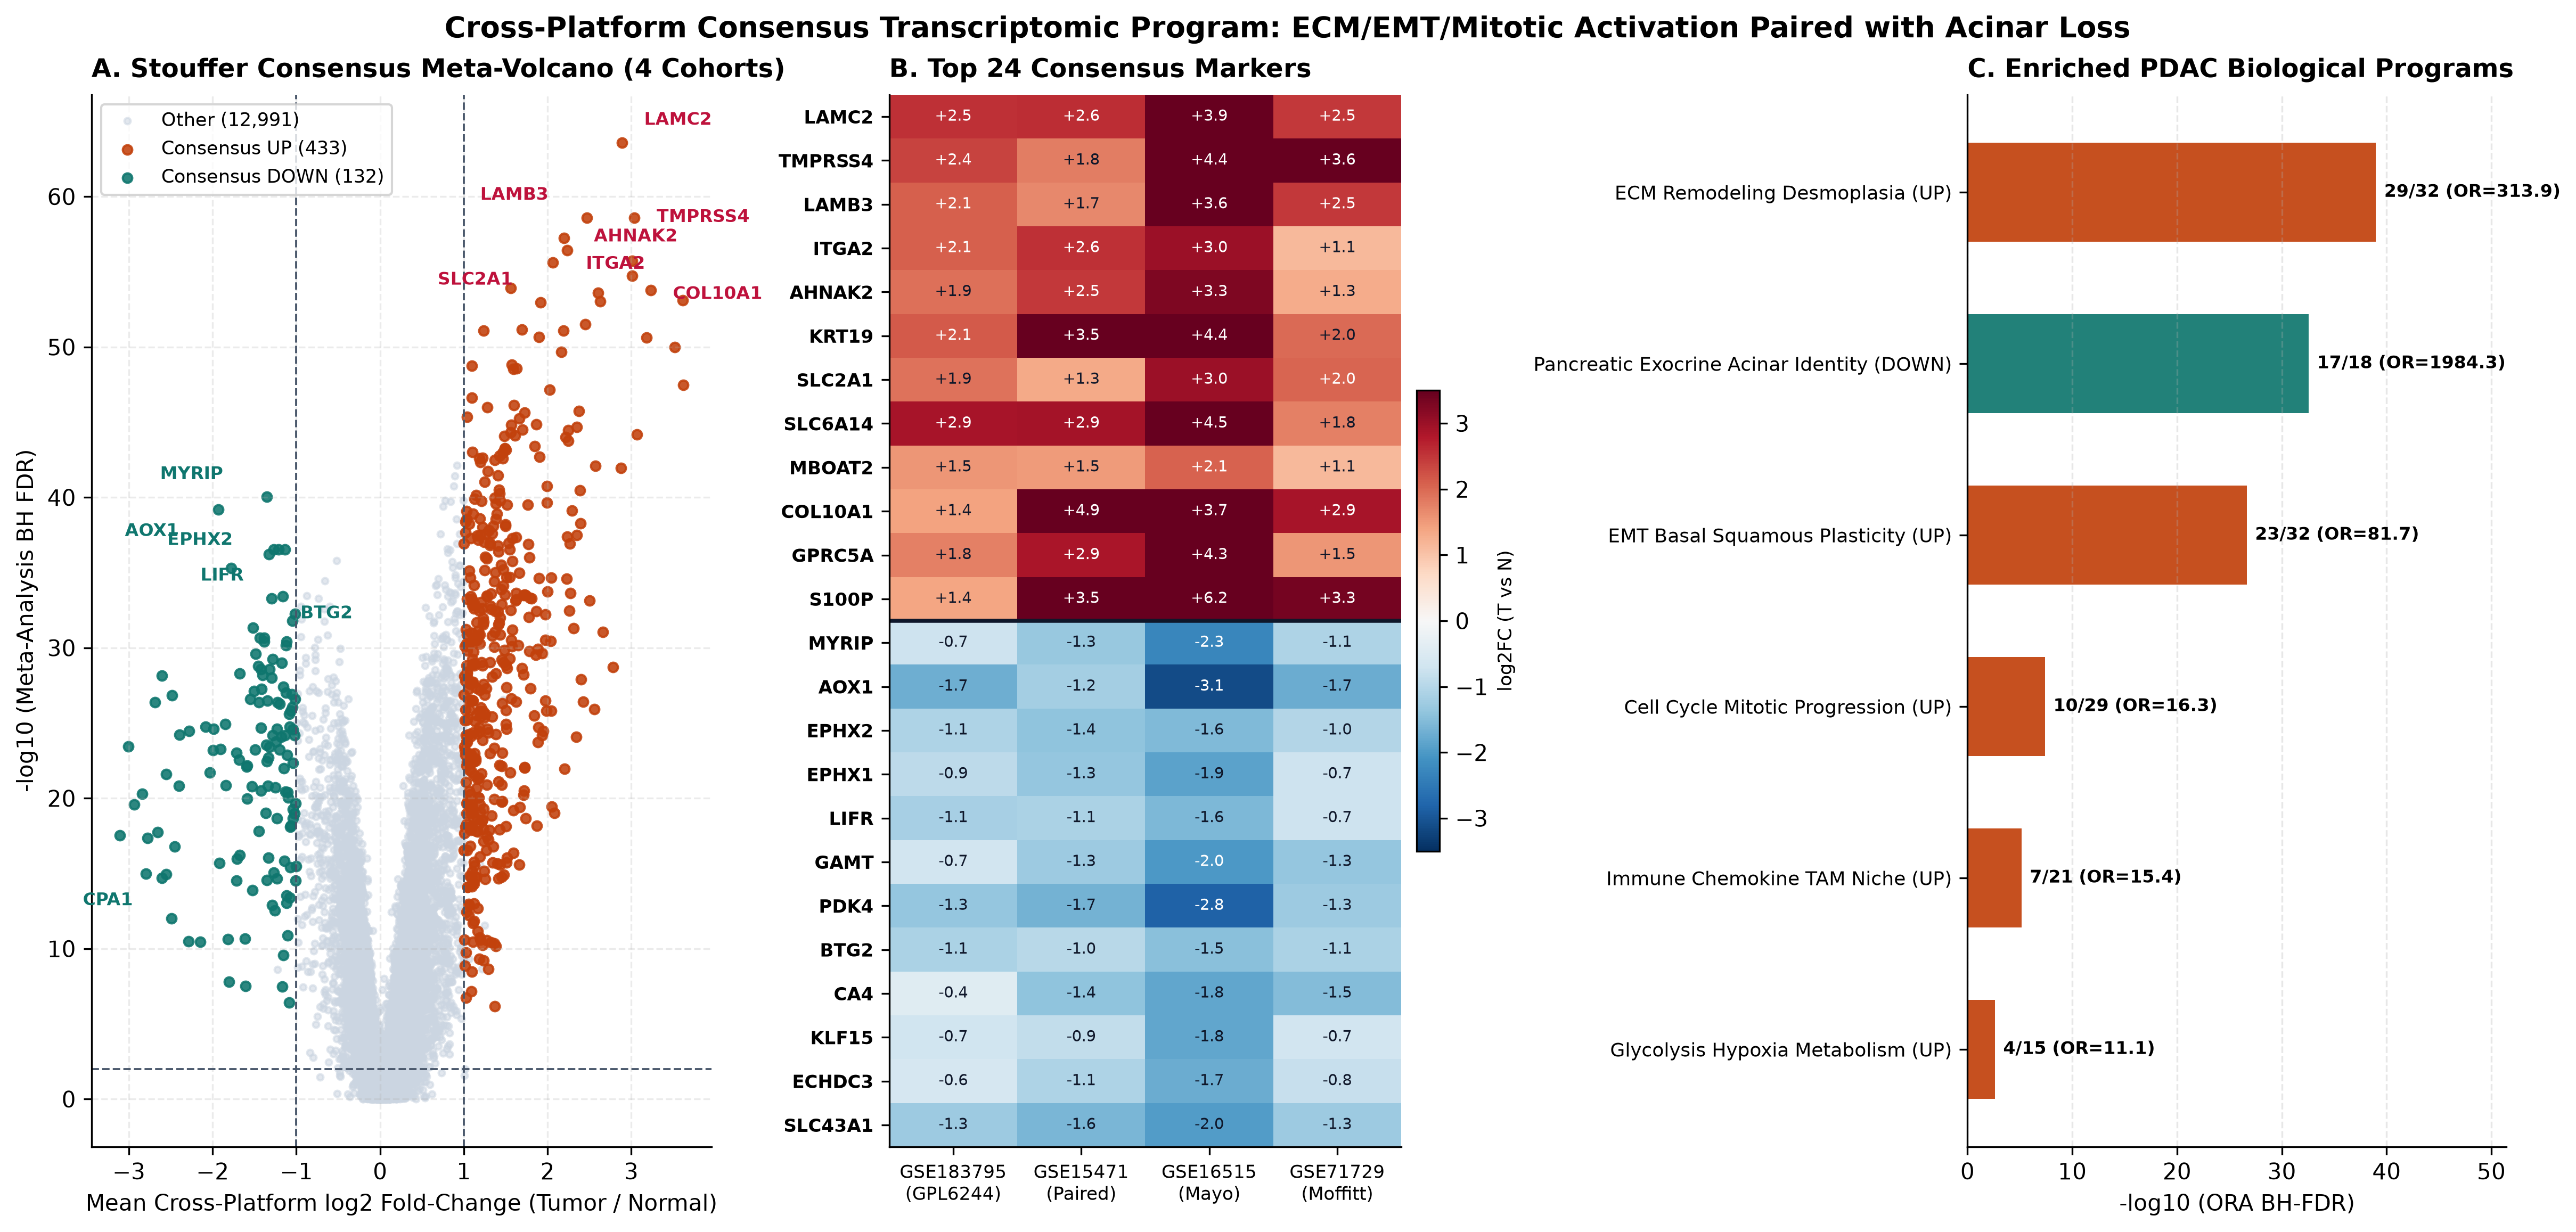
433 Consensus UP / 132 DOWN genes, Desmoplasia/EMT activation, and Acinar enzyme collapse.
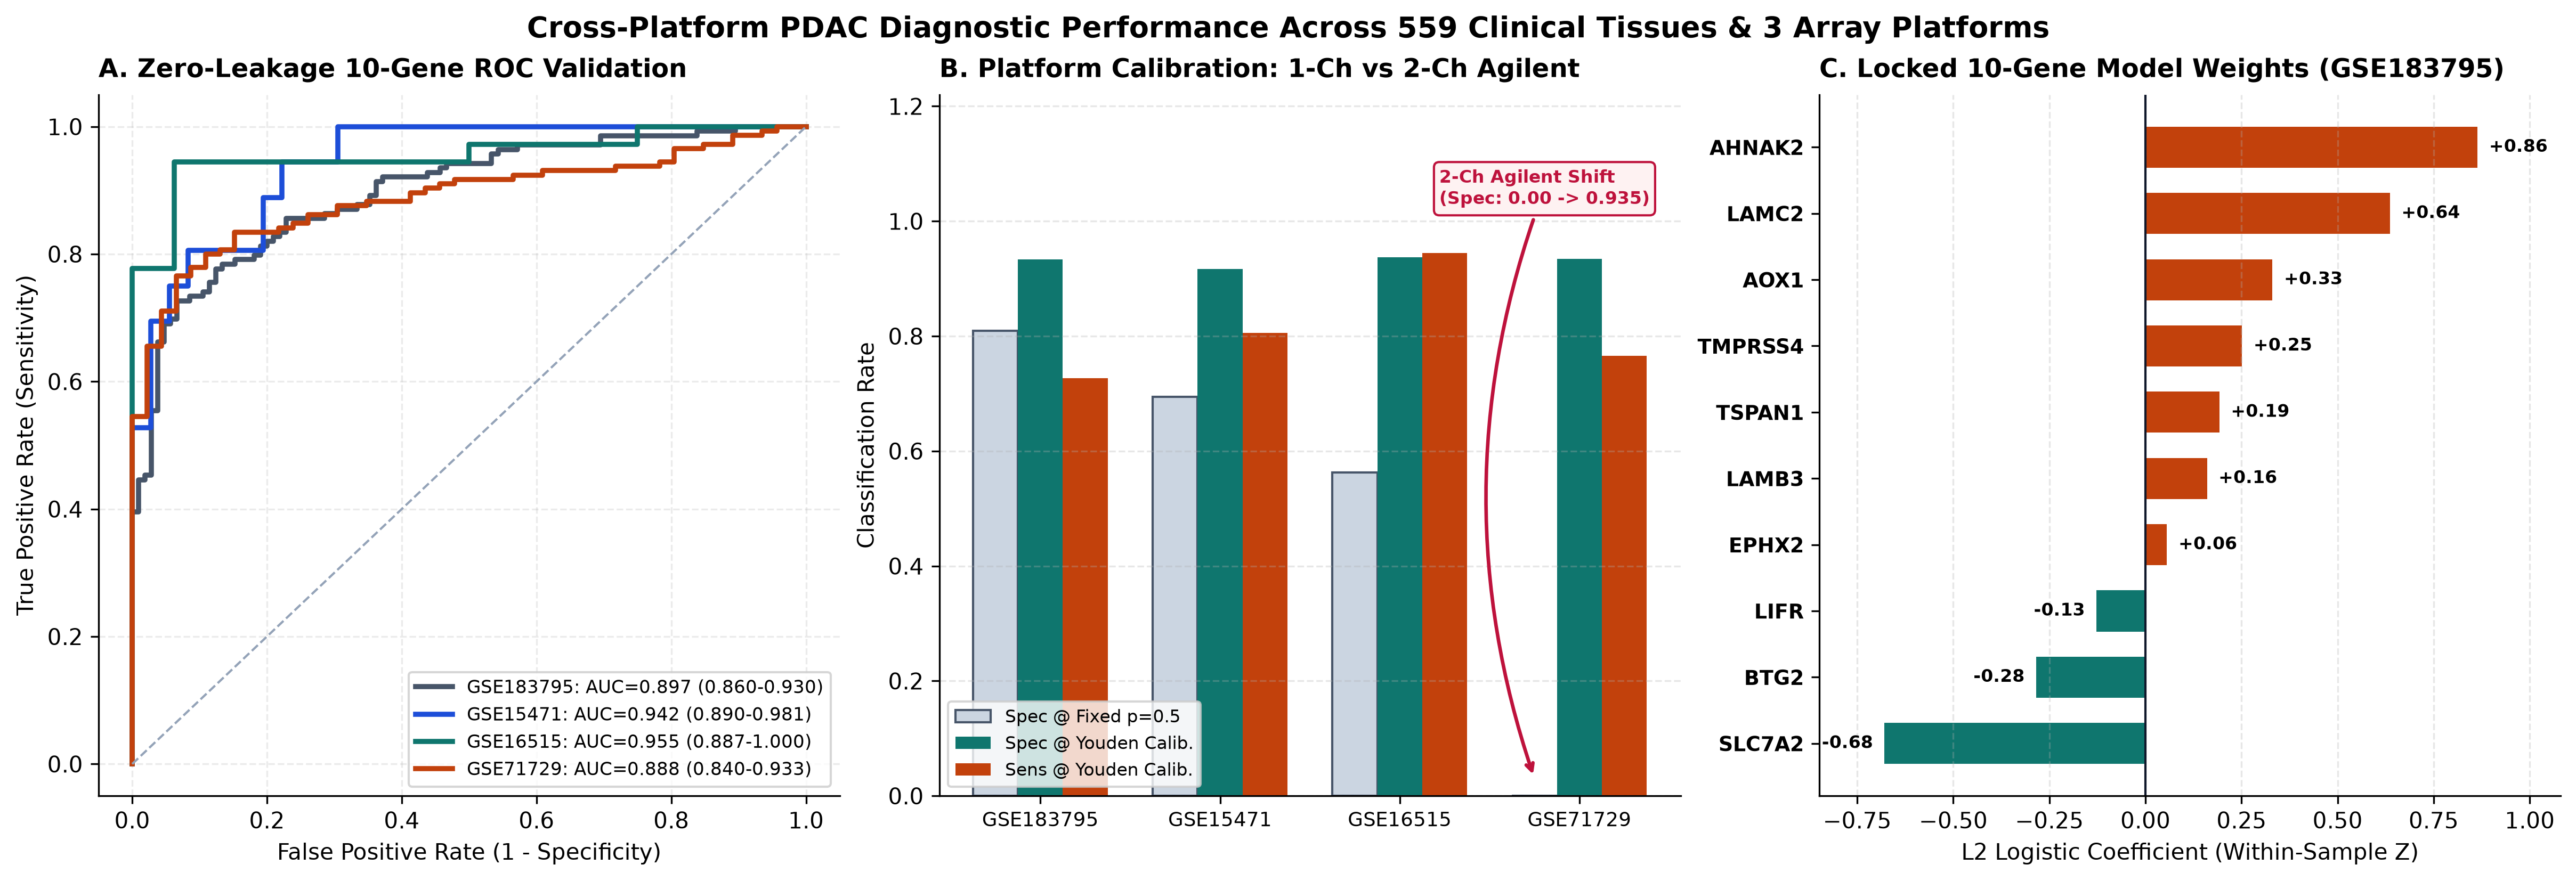
AUCs 0.888 to 0.955 across 559 tissues plus fixed p=0.5 vs Youden two-channel calibration proof.
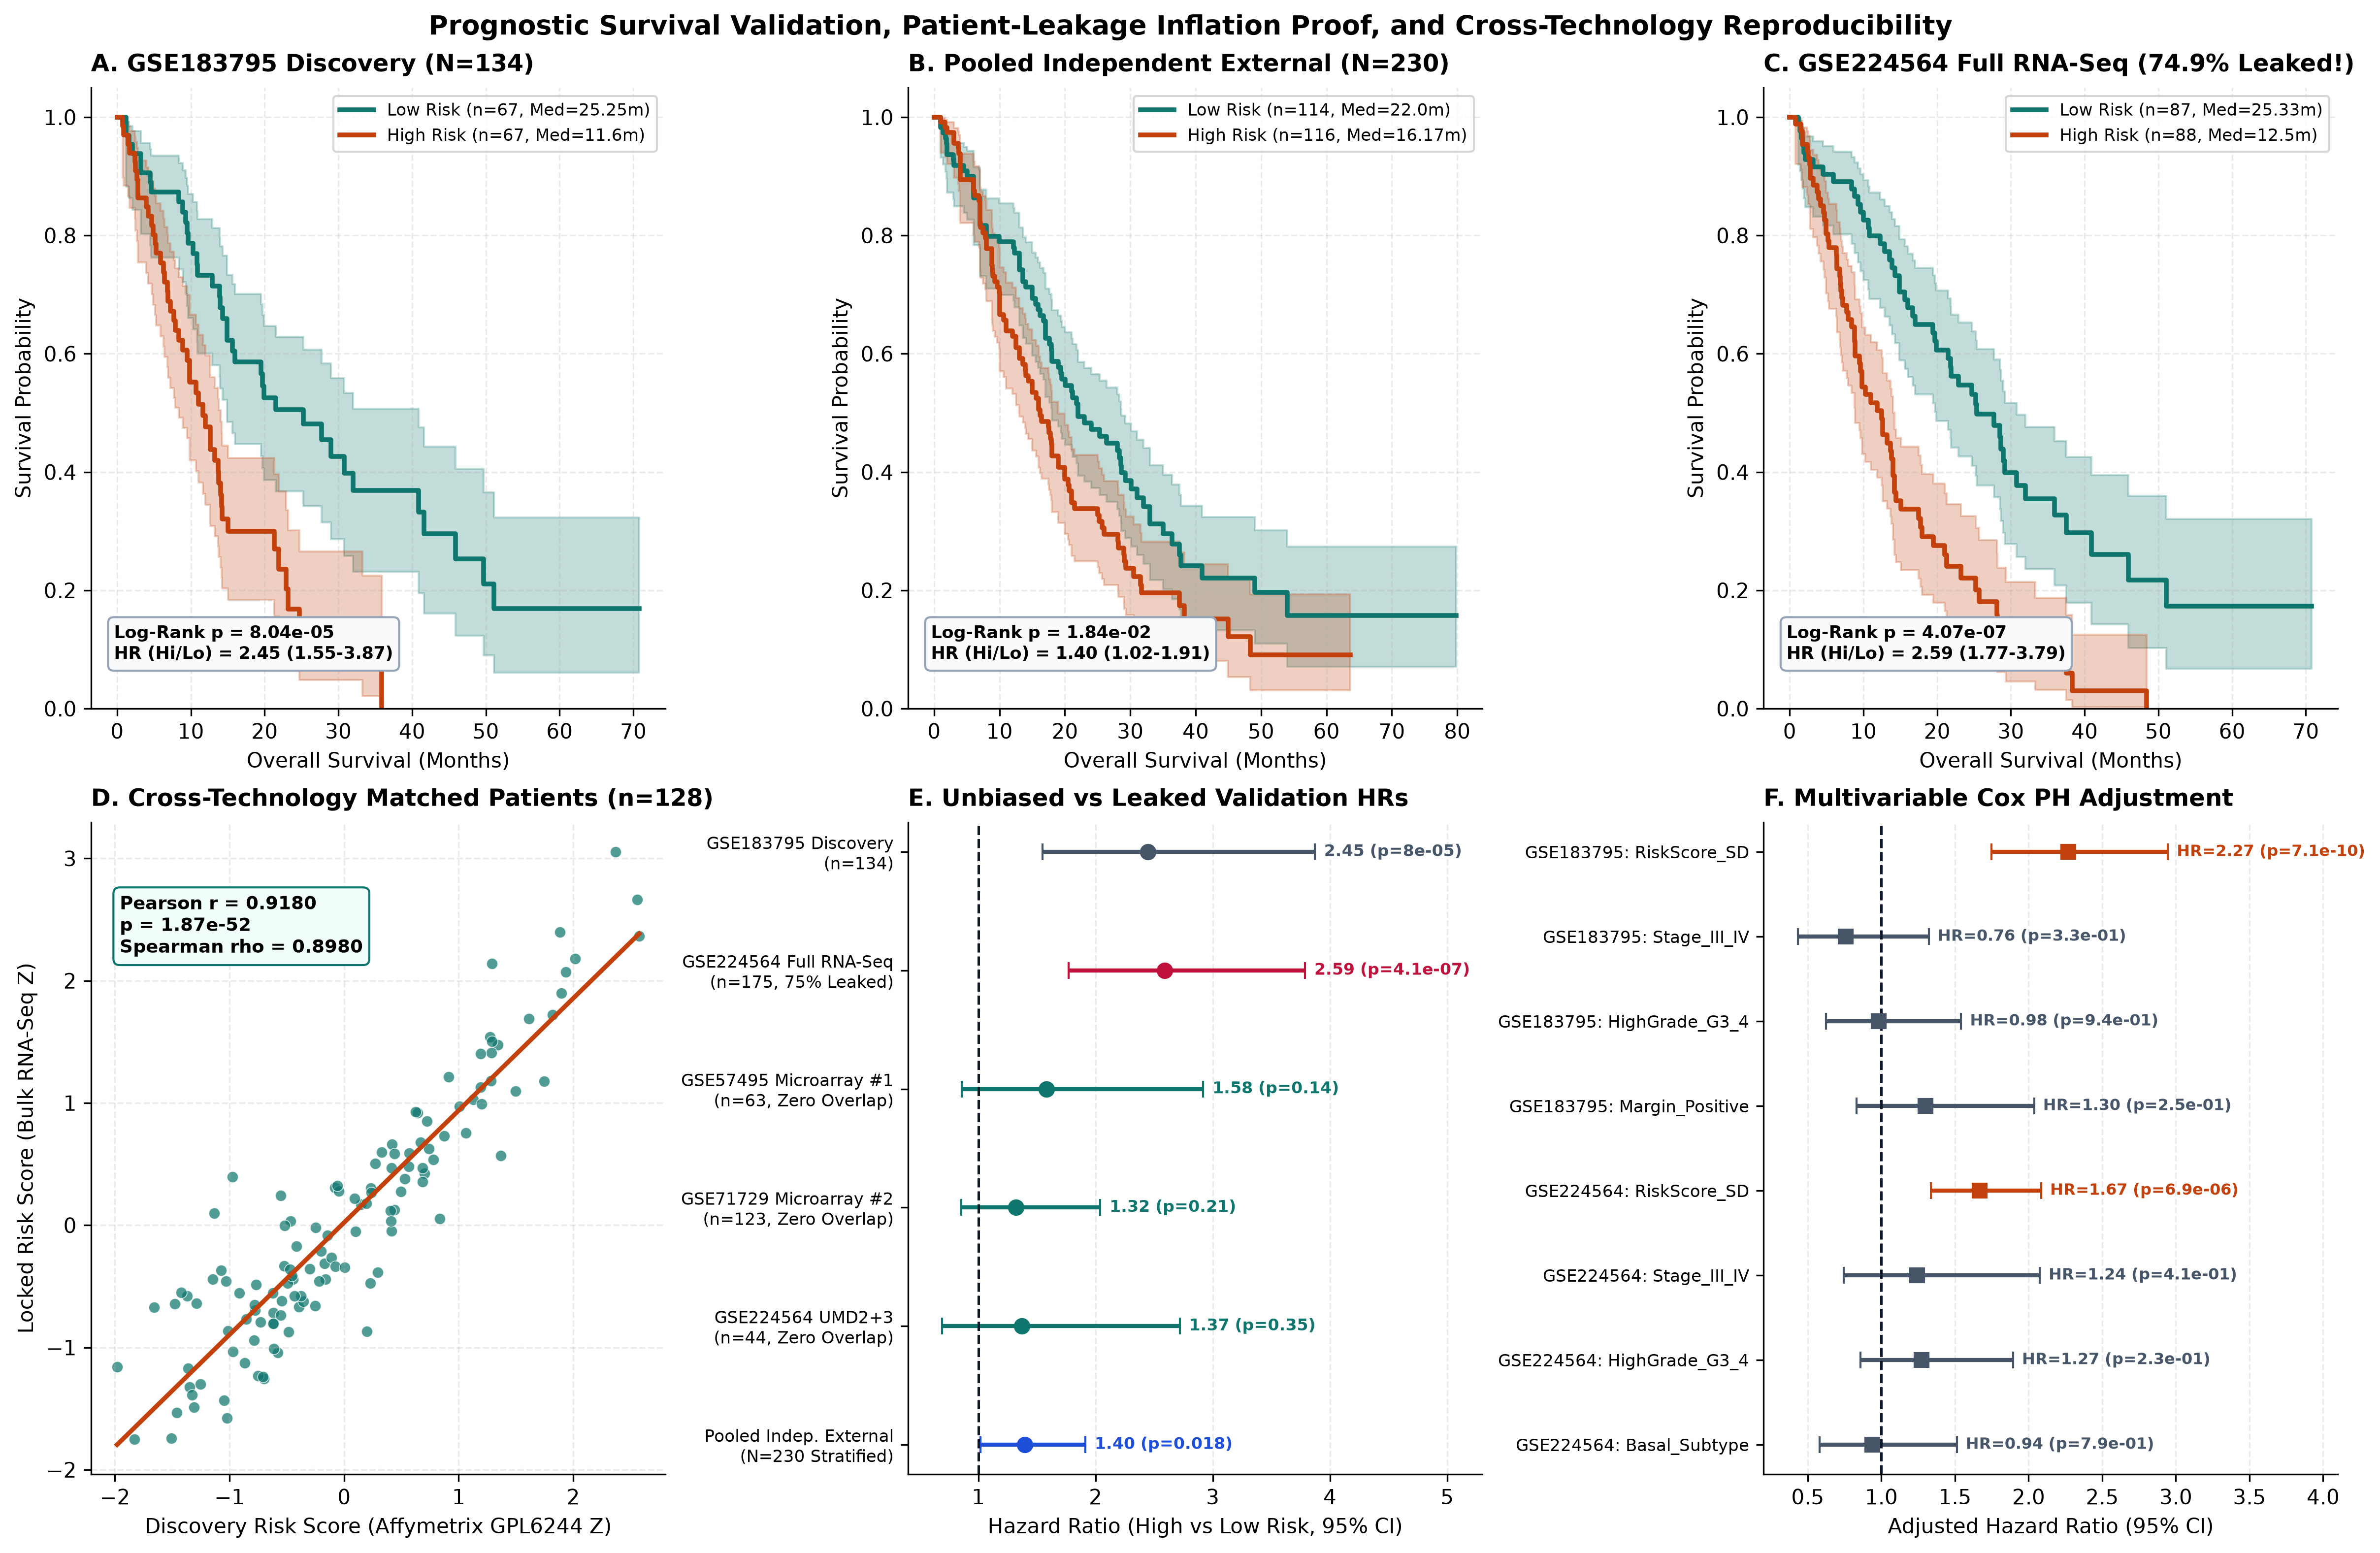
Discovery N=134, Zero-Leakage Pooled N=230, Leaked GSE224564 comparison, and r=0.918 bridge.
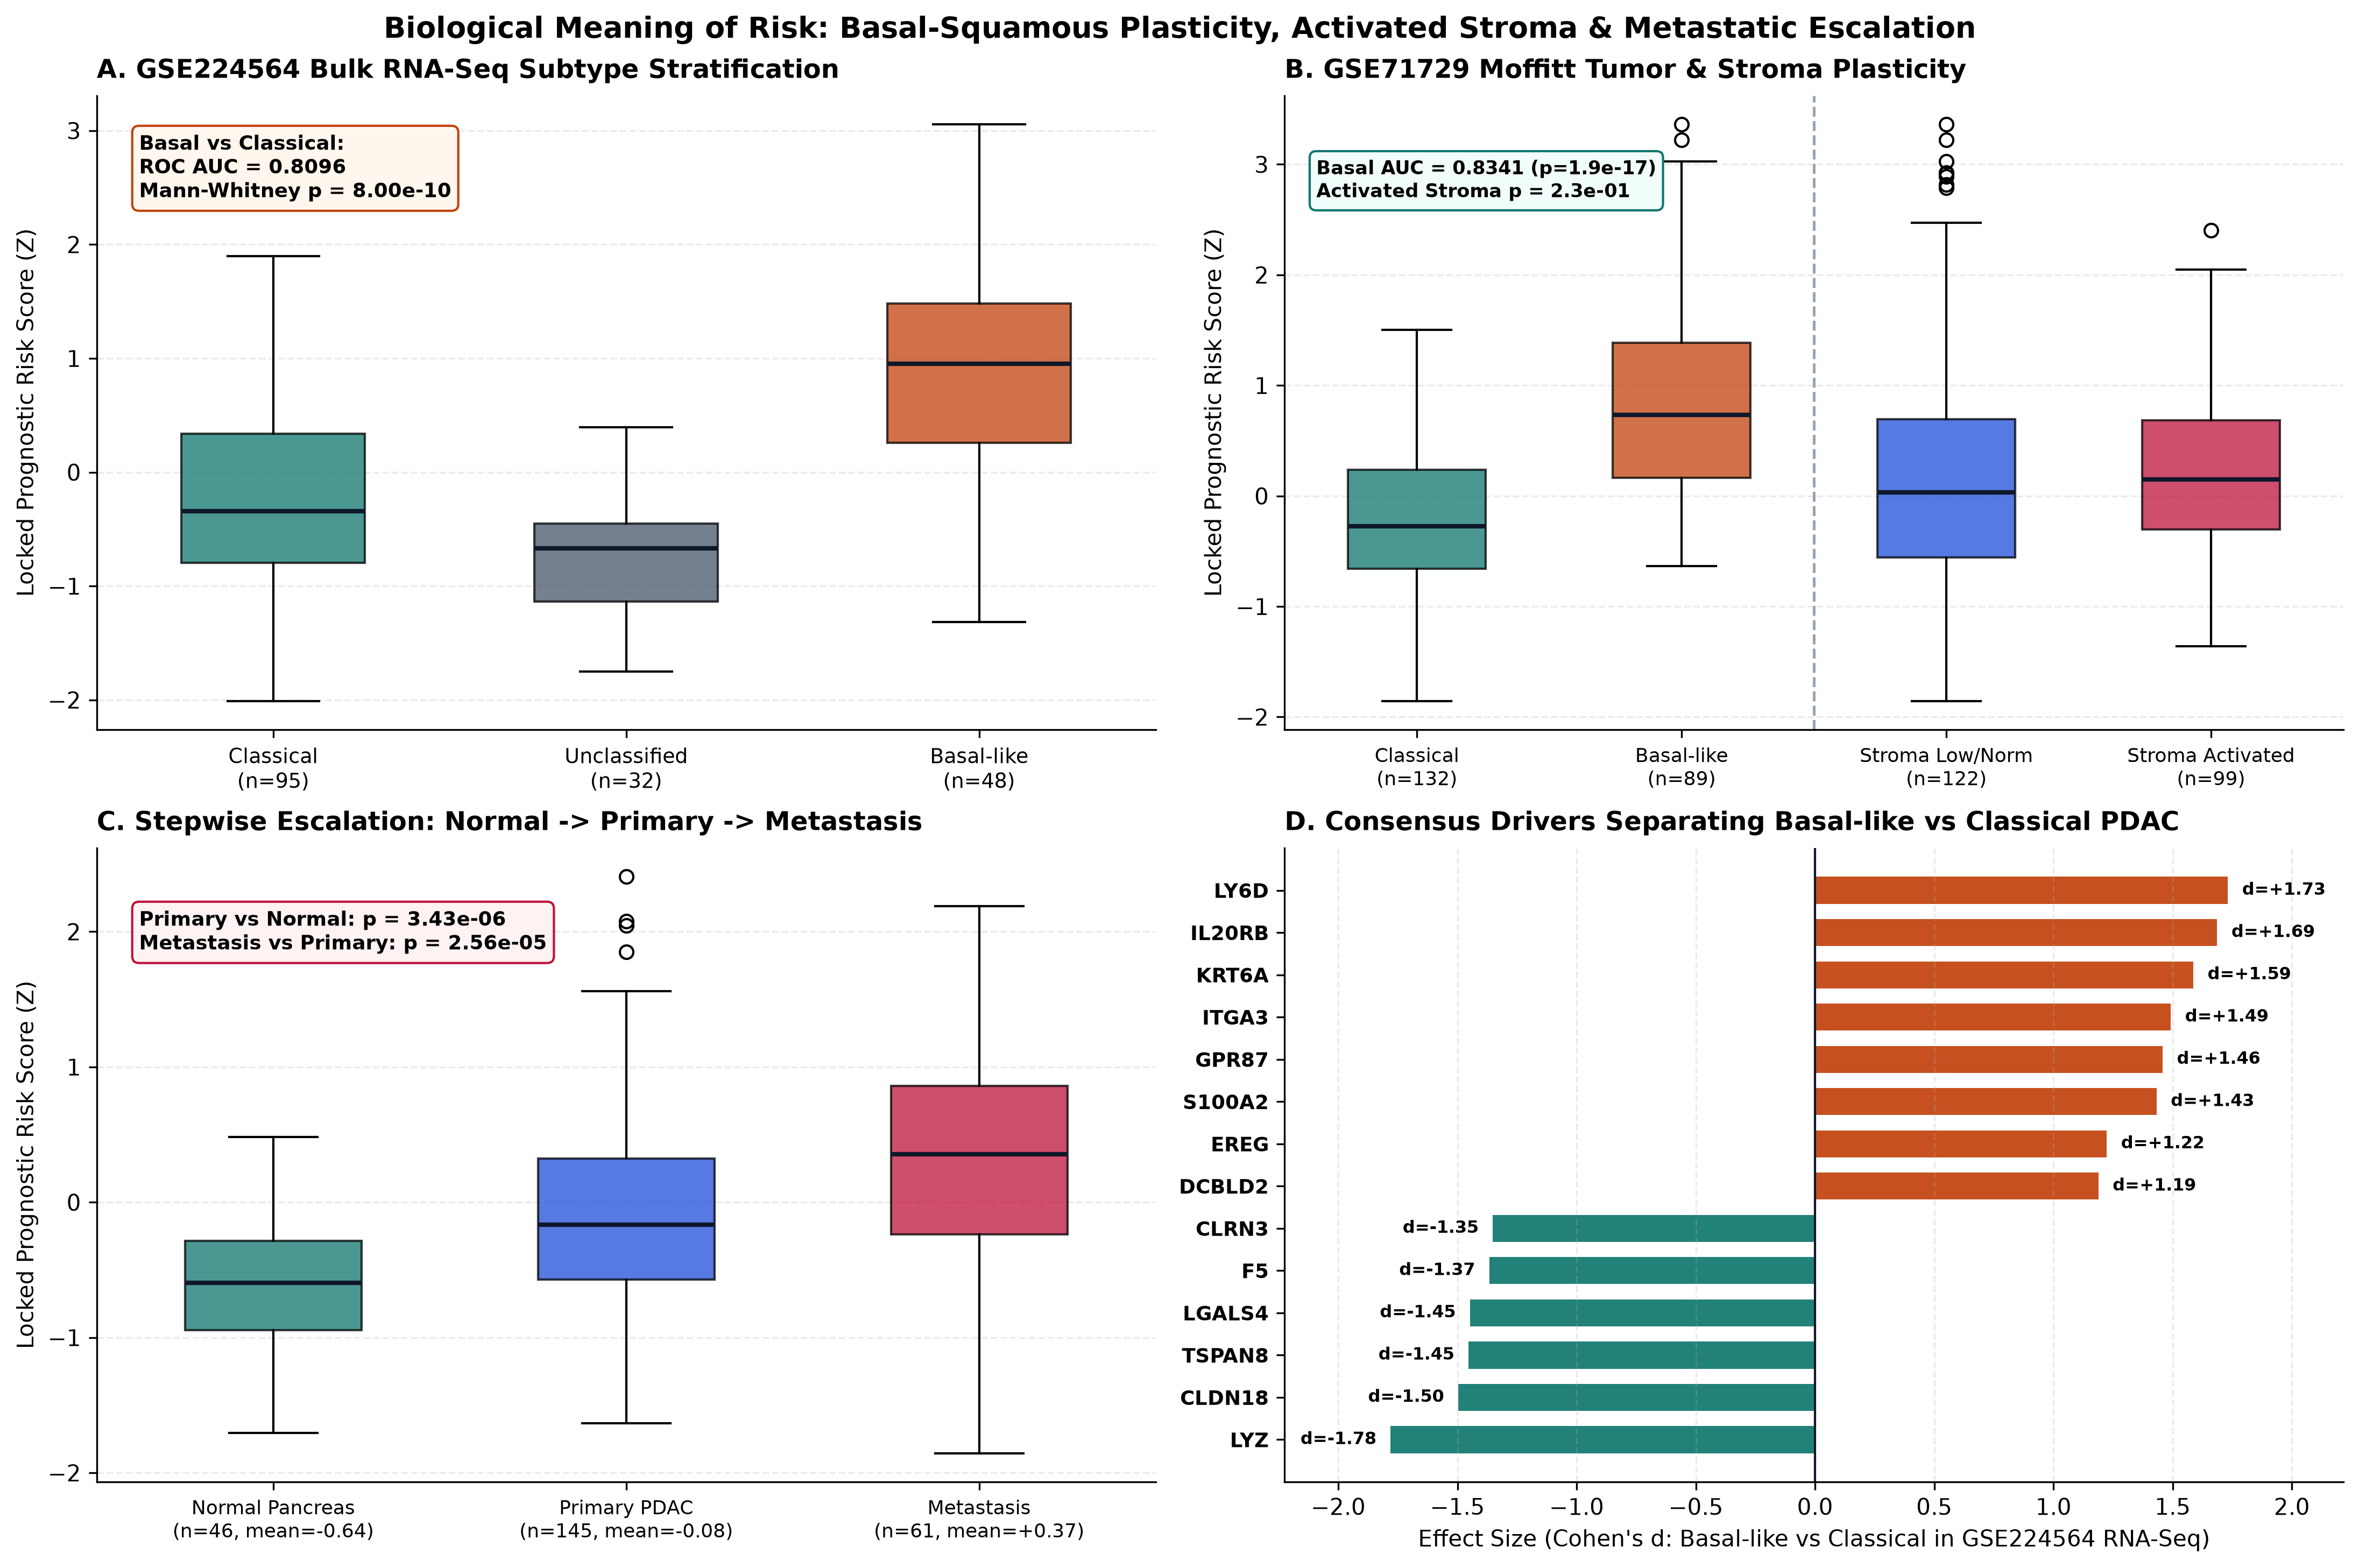
Basal vs Classical risk separation, Normal-Primary-Metastasis escalation, and ITGA3 convergence.
Concrete dissertation tracks anchored directly on audited NCBI GEO cohorts including 2026 experimental releases.
Extends our locked diagnostic and Basal-plasticity pipeline onto freshly resected adjuvant-treated Dutch Parel Biobank RNA-seq (GSE310252, Apr 2026).
Tests whether our EMT/Basal consensus program drives adaptive escape under MRTX1133, sotorasib, and adagrasib across Nov 2026 resistance cohorts.
Models pre-diagnostic circulating miRNA trajectories years prior to onset across 2,614 subjects and validates in serum exosomal miRNA-seq.
Links our computational ITGA3 Basal finding (d=+1.49) to CRISPR dependency screens, hypoxic organoids, and CDK7-inhibitor resistance.
Maps our TAM chemokine and stromal modules onto NanoString GeoMx digital spatial neighborhoods and single-cell cachexia trajectories.
Filter cataloged human PDAC GEO studies and click any accession ID to open the official NCBI record.
| Accession | Samples | Date | Assay Type | Study Title |
|---|